Since I discovered Netdata I knew that is the perfect tool to see some real-time metrics, especially when I need to do some quick investigations related to my app and hardware health.
Official website: https://www.netdata.cloud/
Installation
Netdata offers many ways to install it. You can check their documentation: https://learn.netdata.cloud/docs/agent/packaging/installer
What I love the most is the one-line installation method, a short sh script which is doing everything while you enjoy your coffee. Log into your machine as root or as a user with sudo privileges and type the next command:
bash <(curl -Ss https://my-netdata.io/kickstart.sh) --no-updates --stable-channel --disable-telemetryDuring installation, you will be asked to type Enter, after which the service will be available. As you can see I passed some parameters to the script:
- –no-updates, because i don’t want automatic updates
- –stable-channel, because i want the stable channel
- –disable-telemetry, because i don’t want to send anonymous statistics
Files generated by Netdata:
- the daemon at /usr/sbin/netdata
- config files in /etc/netdata
- web files in /usr/share/netdata
- plugins in /usr/libexec/netdata
- cache files in /var/cache/netdata
- db files in /var/lib/netdata
- log files in /var/log/netdata
- pid file at /var/run/netdata.pid
- logrotate file at /etc/logrotate.d/netdata
After the script finishes to run, check the netdata service:
catalin@devops:~$ sudo systemctl status netdata
● netdata.service - Real time performance monitoring
Loaded: loaded (/lib/systemd/system/netdata.service; enabled; vendor preset: enabled)
Active: active (running) since Sun 2020-05-03 16:38:35 UTC; 30s ago
Process: 21470 ExecStartPre=/bin/mkdir -p /var/cache/netdata (code=exited, status=0/SUCCESS)
Process: 21471 ExecStartPre=/bin/chown -R netdata:netdata /var/cache/netdata (code=exited, status=0/SUCCESS)
Process: 21472 ExecStartPre=/bin/mkdir -p /var/run/netdata (code=exited, status=0/SUCCESS)
Process: 21473 ExecStartPre=/bin/chown -R netdata:netdata /var/run/netdata (code=exited, status=0/SUCCESS)
Main PID: 21474 (netdata)
Tasks: 31 (limit: 9508)
Memory: 59.3M
CGroup: /system.slice/netdata.service
├─21474 /usr/sbin/netdata -P /var/run/netdata/netdata.pid -D
├─21608 bash /usr/libexec/netdata/plugins.d/tc-qos-helper.sh 1
├─21610 /usr/libexec/netdata/plugins.d/apps.plugin 1
├─21611 /usr/bin/python /usr/libexec/netdata/plugins.d/python.d.plugin 1
└─21612 /usr/libexec/netdata/plugins.d/go.d.plugin 1
May 03 16:38:35 devops systemd[1]: Starting Real time performance monitoring...
May 03 16:38:35 devops systemd[1]: Started Real time performance monitoring.
May 03 16:38:35 devops netdata[21474]: SIGNAL: Not enabling reaper
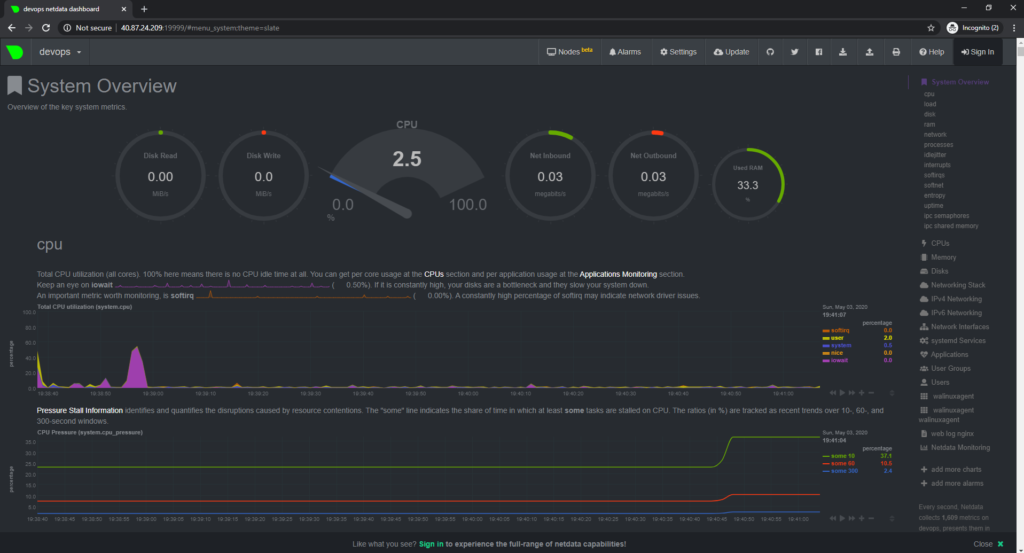
May 03 16:38:35 devops netdata[21474]: 2020-05-03 16:38:35: netdata INFO : MAIN : SIGNAL: Not enabling reaperCheck your browser for the dashboard:
http://server_ip:19999
Some netdata facts:
- default, data retention is for 1 h; you can increase by changing history in /etc/netdata.conf but not longer than 1 day
- depending on how much metrics you have and history, it can consume more memory
- for some software you need configs to collect metric; apache needs mod status, php-fpm status to be activated, access to mysql etc
- during the crash of a server, netdata metrics can be lost, this happened to me
Give it a try and explore this tool.